Draw Synteny Maps
Step 0: Make Sure Requirements.
Our Perl script for drawing dot-plots
requires the GNUplot package
(4.2 or later version) to be installed.
Step 1: Draw Dot-Plots.
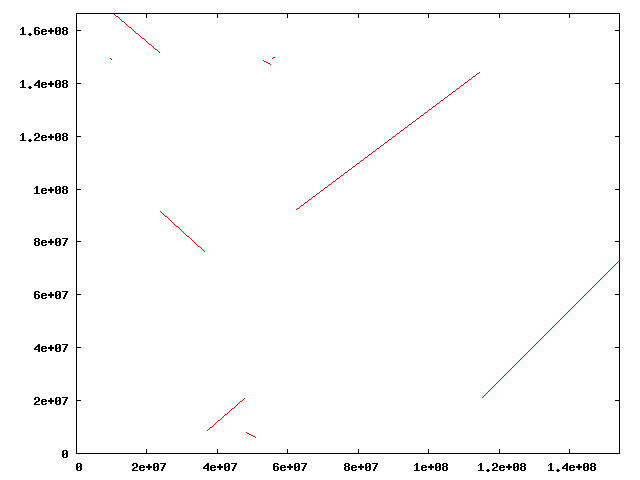
A dot-plots visualizes the genomic positions
of the orthologous segments identified between two chromosomes.
To draw dot-plots between the X chromosome of Homo sapiens
and the X chromosome of Mus musculus, type as below.
Here, we assume that the "chrom_map" file for Homo sapiens
defines the chromosome ID of the human X chromosome as "80",
and that the "chrom_map" file for Mus musculus
defines the X chromosome ID of the mouse X chromosome as "135".
% cd osfinder_v*_*/
% ./scripts/draw_dot_plot.pl -i osfinder_results/hsa-mmu.blastp.os.txt -a 80 -b 135
Then, a PNG file named "hsa-mmu.blastp.os.80vs135.png"
will be created in the "osfinder_results" directory.
By opening the PNG file, you can display the dot-plot
between the human X chromosome
and the mouse X chromosome as below.