Visualize the results of OSfinder
Our distribution includes two Perl scripts
that are helpful to visualize the results of OSfinder.
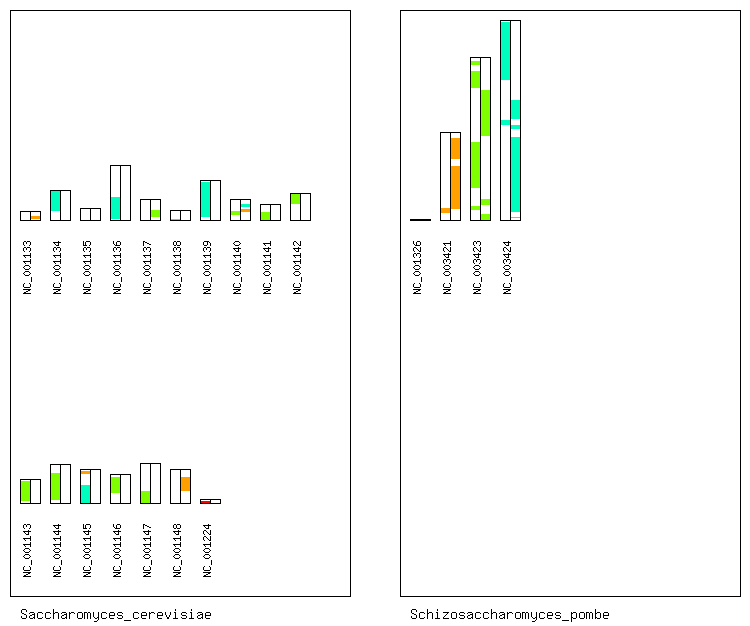
The first Perl script named "draw_synteny_map_pairwise.pl"
draws synteny maps,
which provide you with the overview of the results of the orthology mapping.
The figure shown below is an example of the synteny map.
A detailed description can be found
in the page "Synteny Map".

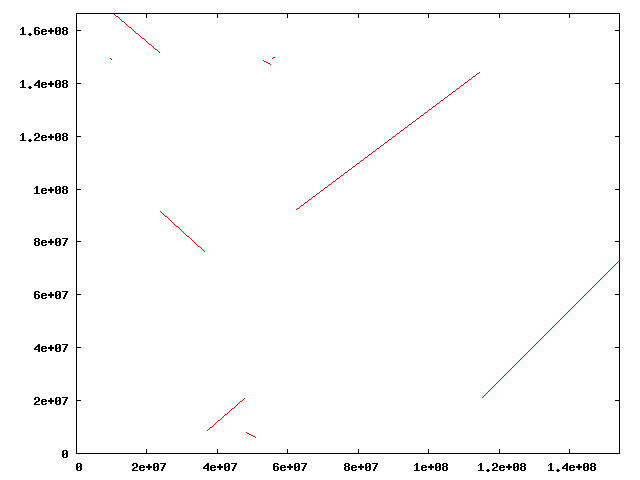
The second Perl script named "draw_dot_plot.pl" draws dot-plots,
which provide you with a more detailed view
of the results of the orthology mapping than synteny maps.
By specifying a pair of chromosomes from different genomes,
a dot-plot is drawn as shown below.
The page "Dot-Plot" explains
how you can draw dot-plots with our Perl scripts.


