Draw Synteny Maps
Step 0: Make Sure Requirements.
Our Perl script for drawing synteny maps
requires
the GD module(2.41 or later version).
Moreover, the GD module requires
the following packages.
The gd graphics library
The PNG graphics library
The zlib compression library
Step 1: Draw Synteny Maps.
To draw synteny maps for visualizing the genomic positions
of the orthologous segments identified between two genomes A and B,
type as follows.
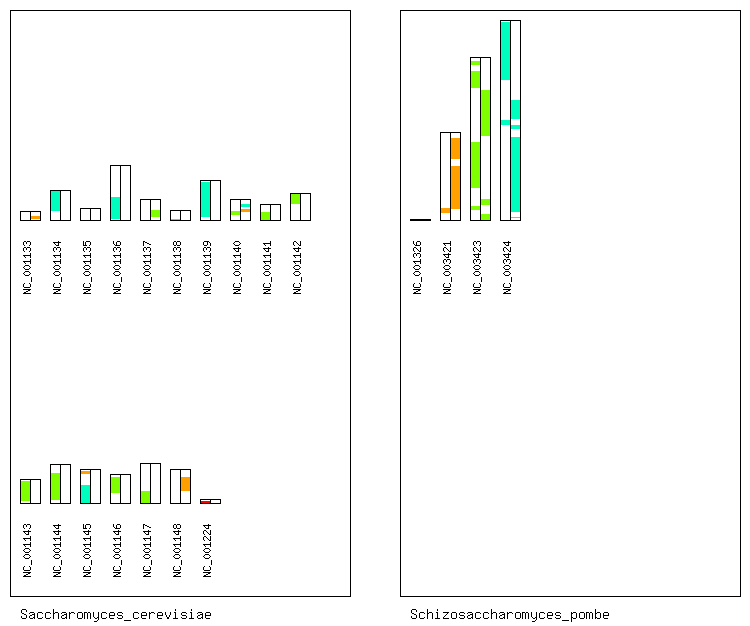
Here, we assume that the genome A is Saccharomyces cerevisiae,
and the genome B is Schizosaccharomyces pombe.
% cd osfinder_v*_*/
% ./scripts/draw_synteny_map_pairwise.pl -i ncbi_seqs/Saccharomyces_cerevisiae/ -d ncbi_seqs/Schizosaccharomyces_pombe/ -s osfinder_results/sce-spo.blastp.os.txt
Then, a PNG file named "sce-spo.blastp.os.txt.synteny_map.png"
will be created in the directory "osfinder_results/".
By opening the PNG file, you can display the synteny map
between Saccharomyces cerevisiae
and Schizosaccharomyces pombe.
Step 1': Draw Synteny Maps Between Human and Mouse.
The MFA-formatted protein sequence file for the human genome
downloaded from the Ensembl genome browser
include not only the protein sequences
encoded in fully assembled chromosomes
but also the protein sequences
encoded in supercontigs.
Consequently, the sum of the number of the chromosomes
and the number of the supercontigs is greater than 80
(release version 52).
In such situations, the synteny maps that visualize
all chromosomes and supercontigs will become figures
that are not easy to understand.
Thus, our Perl script has the "-l" option
by which you can set the threshold of the contig length.
Our Perl script visualizes only chromosomes and supercontigs
whose length is greater than the threshold length.
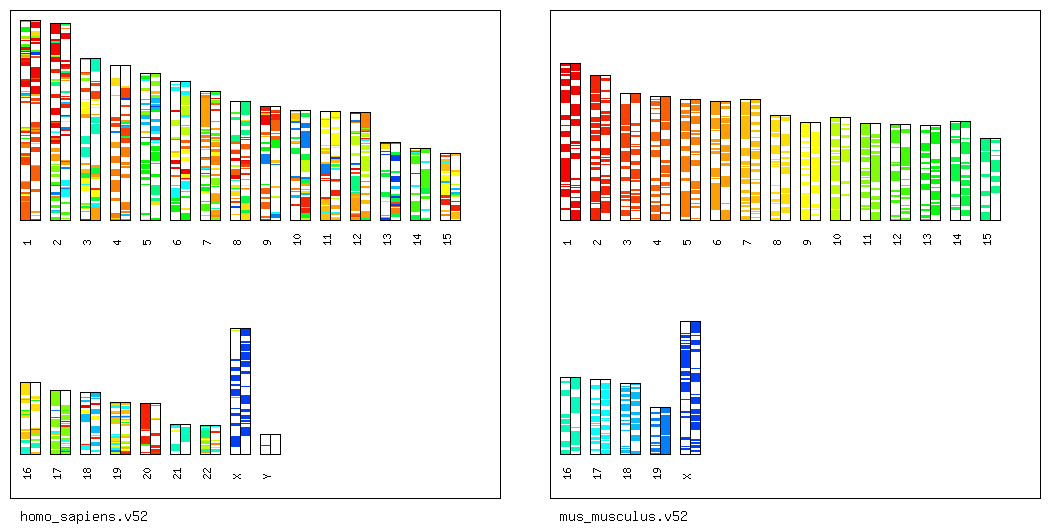
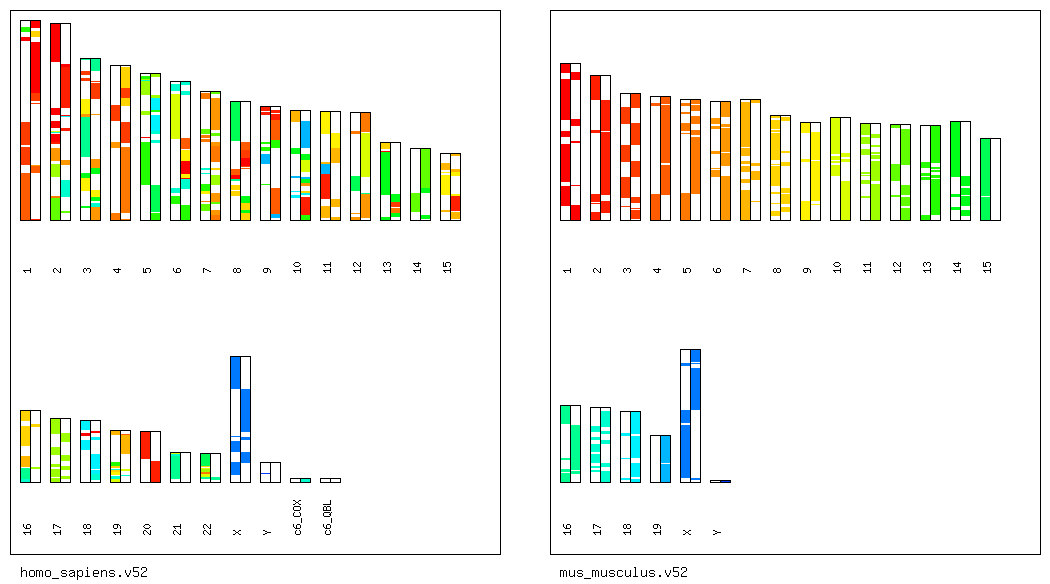
To obtain the synteny map between human and mouse
that is easy to understand,
type as follows.
% ./scripts/draw_synteny_map_pairwise.pl -i ensembl_seqs/homo_sapiens.v52/ -d ensembl_seqs/mus_musculus.v52/ -s osfinder_results/hsa-mmu.blastp.os.txt -l 2000000
Then, a PNG file named "hsa-mmu.blastp.os.txt.synteny_map.png"
will be created in the directory "osfinder_results/".
By opening the PNG file, you can display the following figure.
Step 1'': Visualize the Genomic Positions of
the Anchors and Chains.
Our Perl script "draw_synteny_map_pairwise.pl" can be applied
not only to the files that include the genomic positions
of the orthologous segments
but also to the files that include the genomic positions
of the anchors or the chains,
as these three files have the same format.
To visualize the genomic positions of the chains
detected between human and mouse,
type as follows.
% ./scripts/draw_synteny_map_pairwise.pl -i ensembl_seqs/homo_sapiens.v52/ -d ensembl_seqs/mus_musculus.v52/ -s osfinder_results/hsa-mmu.blastp.chain.txt
Then, a PNG file named "hsa-mmu.blastp.chain.txt.synteny_map.png"
will be created in the directory "osfinder_results/".
By opening the PNG file, you can display the following figure.
(A visualization of the anchors can be performed
in a similar manner.)